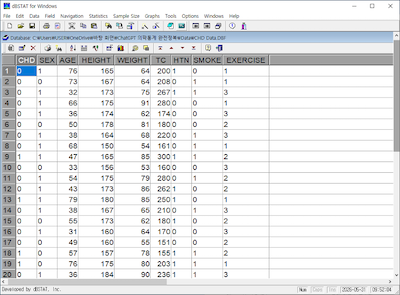
Comprehensive Statistical Analysis
The program provides concise, non-mathematical explanations for all results. It offers a wide range of statistical tests and many handy features not found in programs such as SPSS - for example, statistical wizard, easy analysis from summary data, diagnostic statistics, sample size calculation and more.
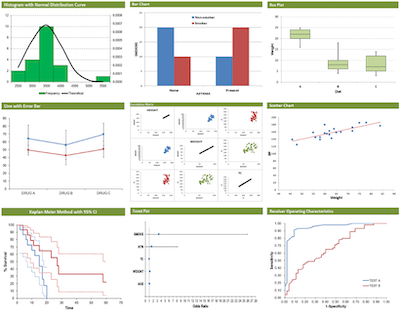
- Descriptive Statistics: frequency, mean, median, SD, IQR, 95% confidence intervals (95% CI), outlier tests (Grubbs’ test), normality tests (Shapiro-Wilk, Kolmogorov-Smirnov)
- Comparative Analysis: z-test, t-test (Student’s, Welch’s t-test, paired t-test), ANOVA, ANCOVA, Cross-tabulation (chi-square, Fisher’s exact test), Comparison of correlation
- Relationship Analysis: Correlation, Regression and Diagnostics (residual analysis)
- Classification: logistic regression, discriminant analysis
- Nonparametric Test: Mann-Whitney U test (Wilcoxon rank-sum test), Wilcoxon signed-rank test, Kruskal-Wallis test, sign test, runs test, binomial test, McNemar’s test, Cochran’s Q test, Friedman test, Jonckheere-Terpstra test, Mantel-Haenszel test, etc.
- Multivariate Analysis: MANOVA, cluster analysis, factor analysis, principal component analysis (PCA)
- Survival Analysis: Life table, Kaplan-Meier method, log-rank test, Cox regression (Cox proportional hazards model)
- Diagnostic Test: Sensitivity/Specificity, ROC curve analysis, Odds Ratio (OR), Relative Risk (RR), Cohen’s kappa, ICC, Cronbach’s alpha, Bland-Altman method
- Sample Size Calculation: means, proportions, survival, diagnostic studies, correlation
- Trend Analysis: Cox-Stuart test, chi-square test for trend, Mantel-Haenszel test, etc.